AI Security Analyst — Automated Alert Triage and Investigation
Security teams are not short on alerts. They are short on time to investigate them.
A typical production environment running endpoint detection generates tens to hundreds of alerts per day. The majority turn out to be benign — a container runtime triggering a namespace change, a monitoring script touching a sensitive file, a legitimate admin session that matches a brute-force pattern. Each one still requires an analyst to open it, pull context, check the process tree, cross-reference recent activity, and make a judgment call. That judgment takes 10–30 minutes per alert even for experienced operators.
The math does not work. When the queue grows faster than the team can triage, real threats sit unreviewed. Alert fatigue sets in. Analysts start skimming instead of investigating. Attacker dwell time increases.
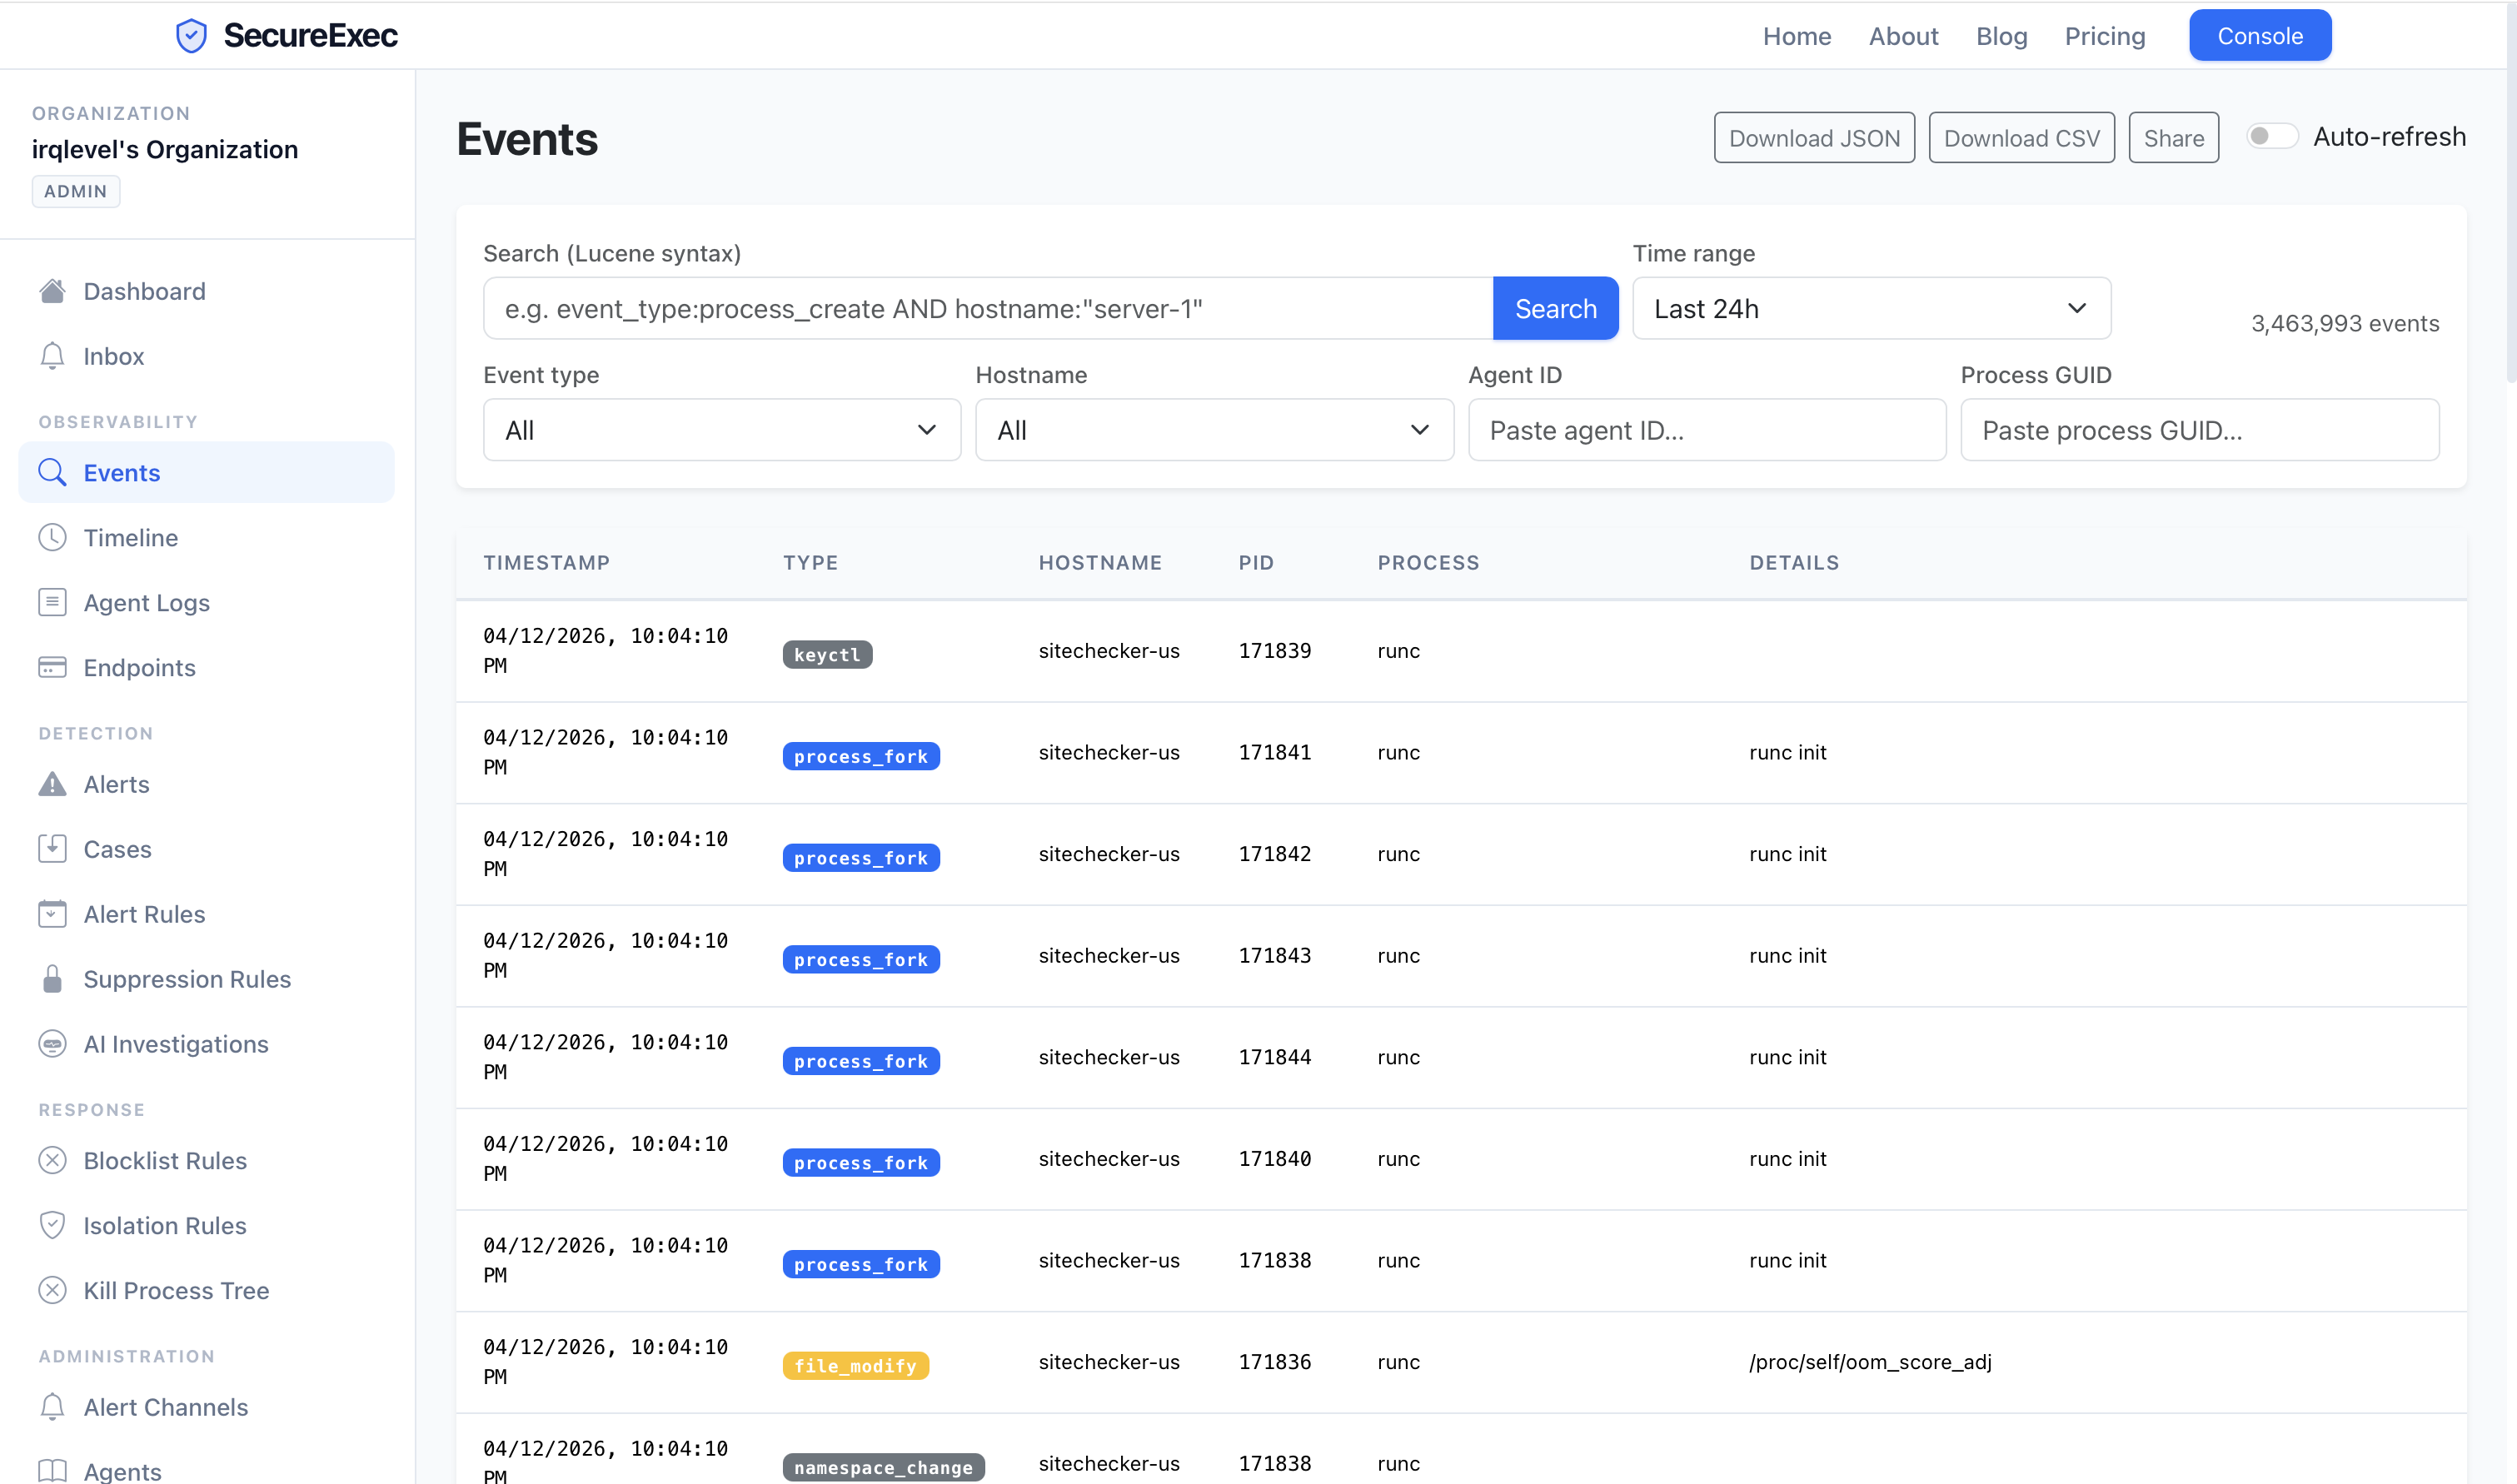
Why simple automation falls short
The standard industry response is automation: SOAR playbooks, severity-based suppression rules, static enrichment pipelines. These help, but they hit a ceiling quickly.
Threshold-based suppression ("ignore all medium-severity alerts from this rule") will eventually discard a true positive that happens to match the suppression pattern. Static playbooks ("if alert type is X, run script Y") can enrich an alert with context, but they cannot reason about whether that context makes the alert benign or dangerous. They lack the ability to say: "This setns call looks like a container escape attempt, but the process tree shows it was initiated by runc as part of normal Docker orchestration on a host that runs containerized workloads — this is expected behavior."
That kind of reasoning requires understanding context, not just matching patterns.
How SecureExec's AI analyst works
SecureExec includes a built-in AI security analyst that investigates alerts the same way a human SOC analyst would — by gathering evidence, examining context, and forming a conclusion.
Under the hood, the analyst runs a ReAct (Reasoning + Acting) agent loop powered by any OpenAI-compatible LLM. It is not a simple prompt-and-respond system. The agent has access to investigative tools and decides which ones to call based on what it finds:
- Alert details — reads the full alert including all related events, rule metadata, and threat intelligence verdicts.
- Process tree — walks the execution chain to understand what spawned the suspicious process, what its parent was, and what children it created.
- Event search — queries the event timeline around the alert's timestamp to look for corroborating or exonerating evidence: network connections, file modifications, privilege changes.
- Endpoint context — checks the host's OS, role, tags, agent version, and isolation status.
- Alert history — looks for recurring patterns on the same host or from the same rule to distinguish a one-off anomaly from a persistent noisy pattern.
For any given investigation, the agent pulls data like the full process ancestry and the surrounding event timeline, and reasons over it directly — the same views an analyst would open by hand:
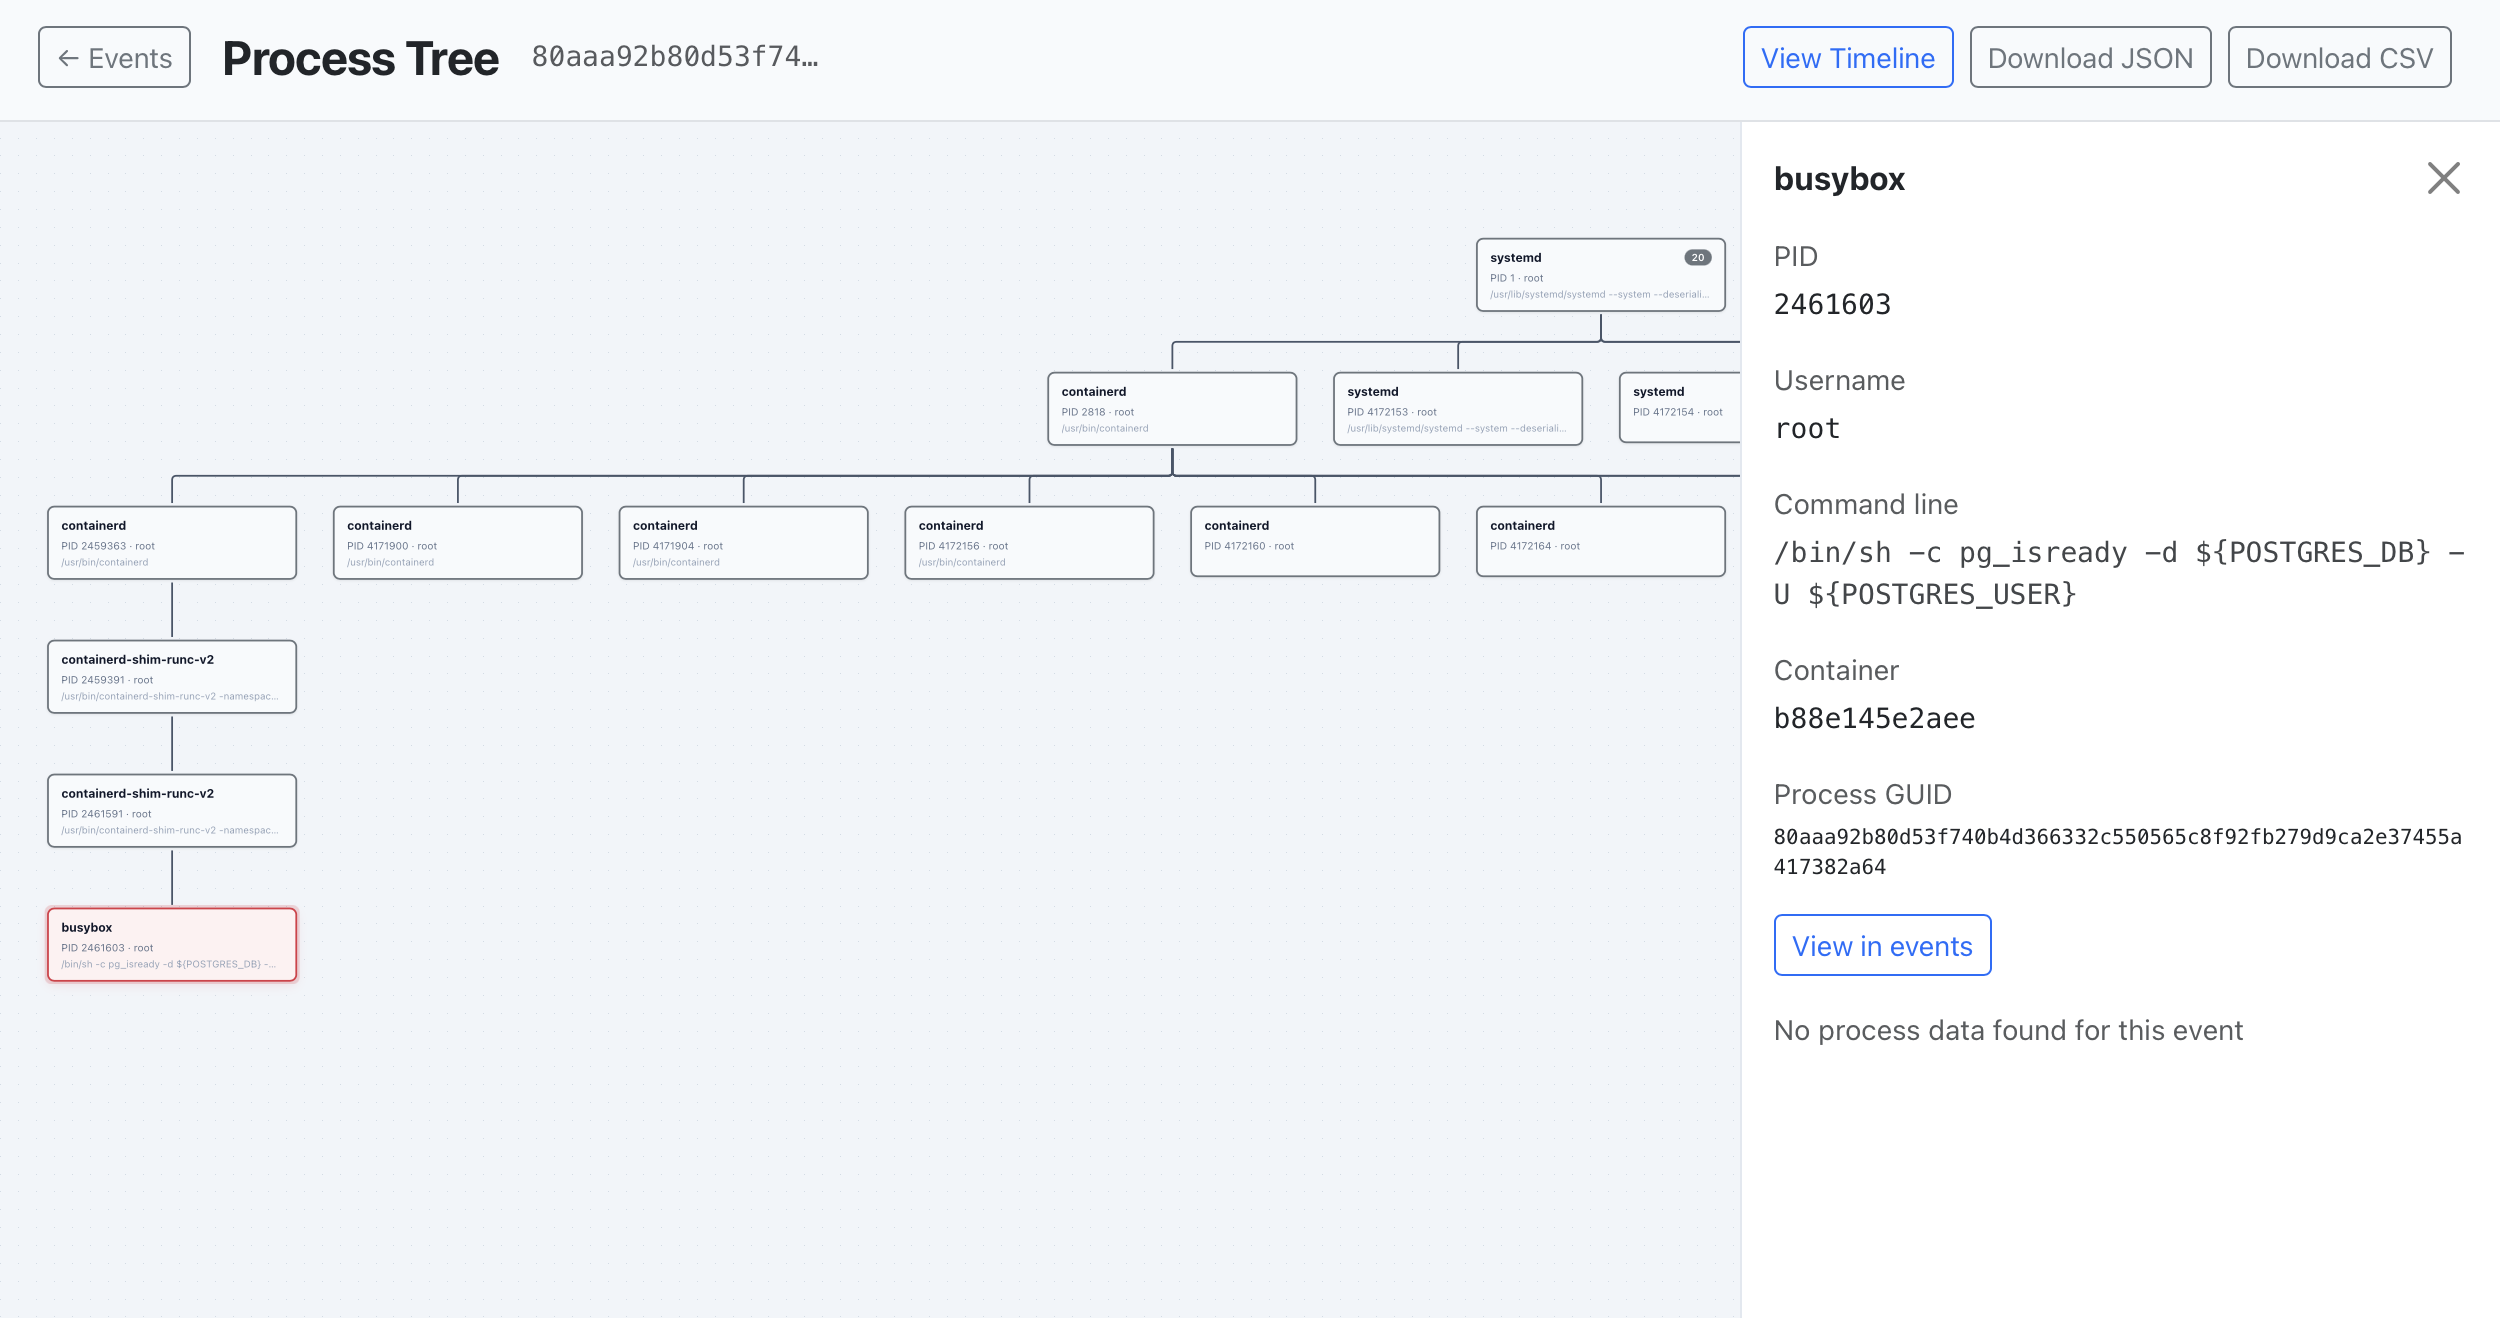
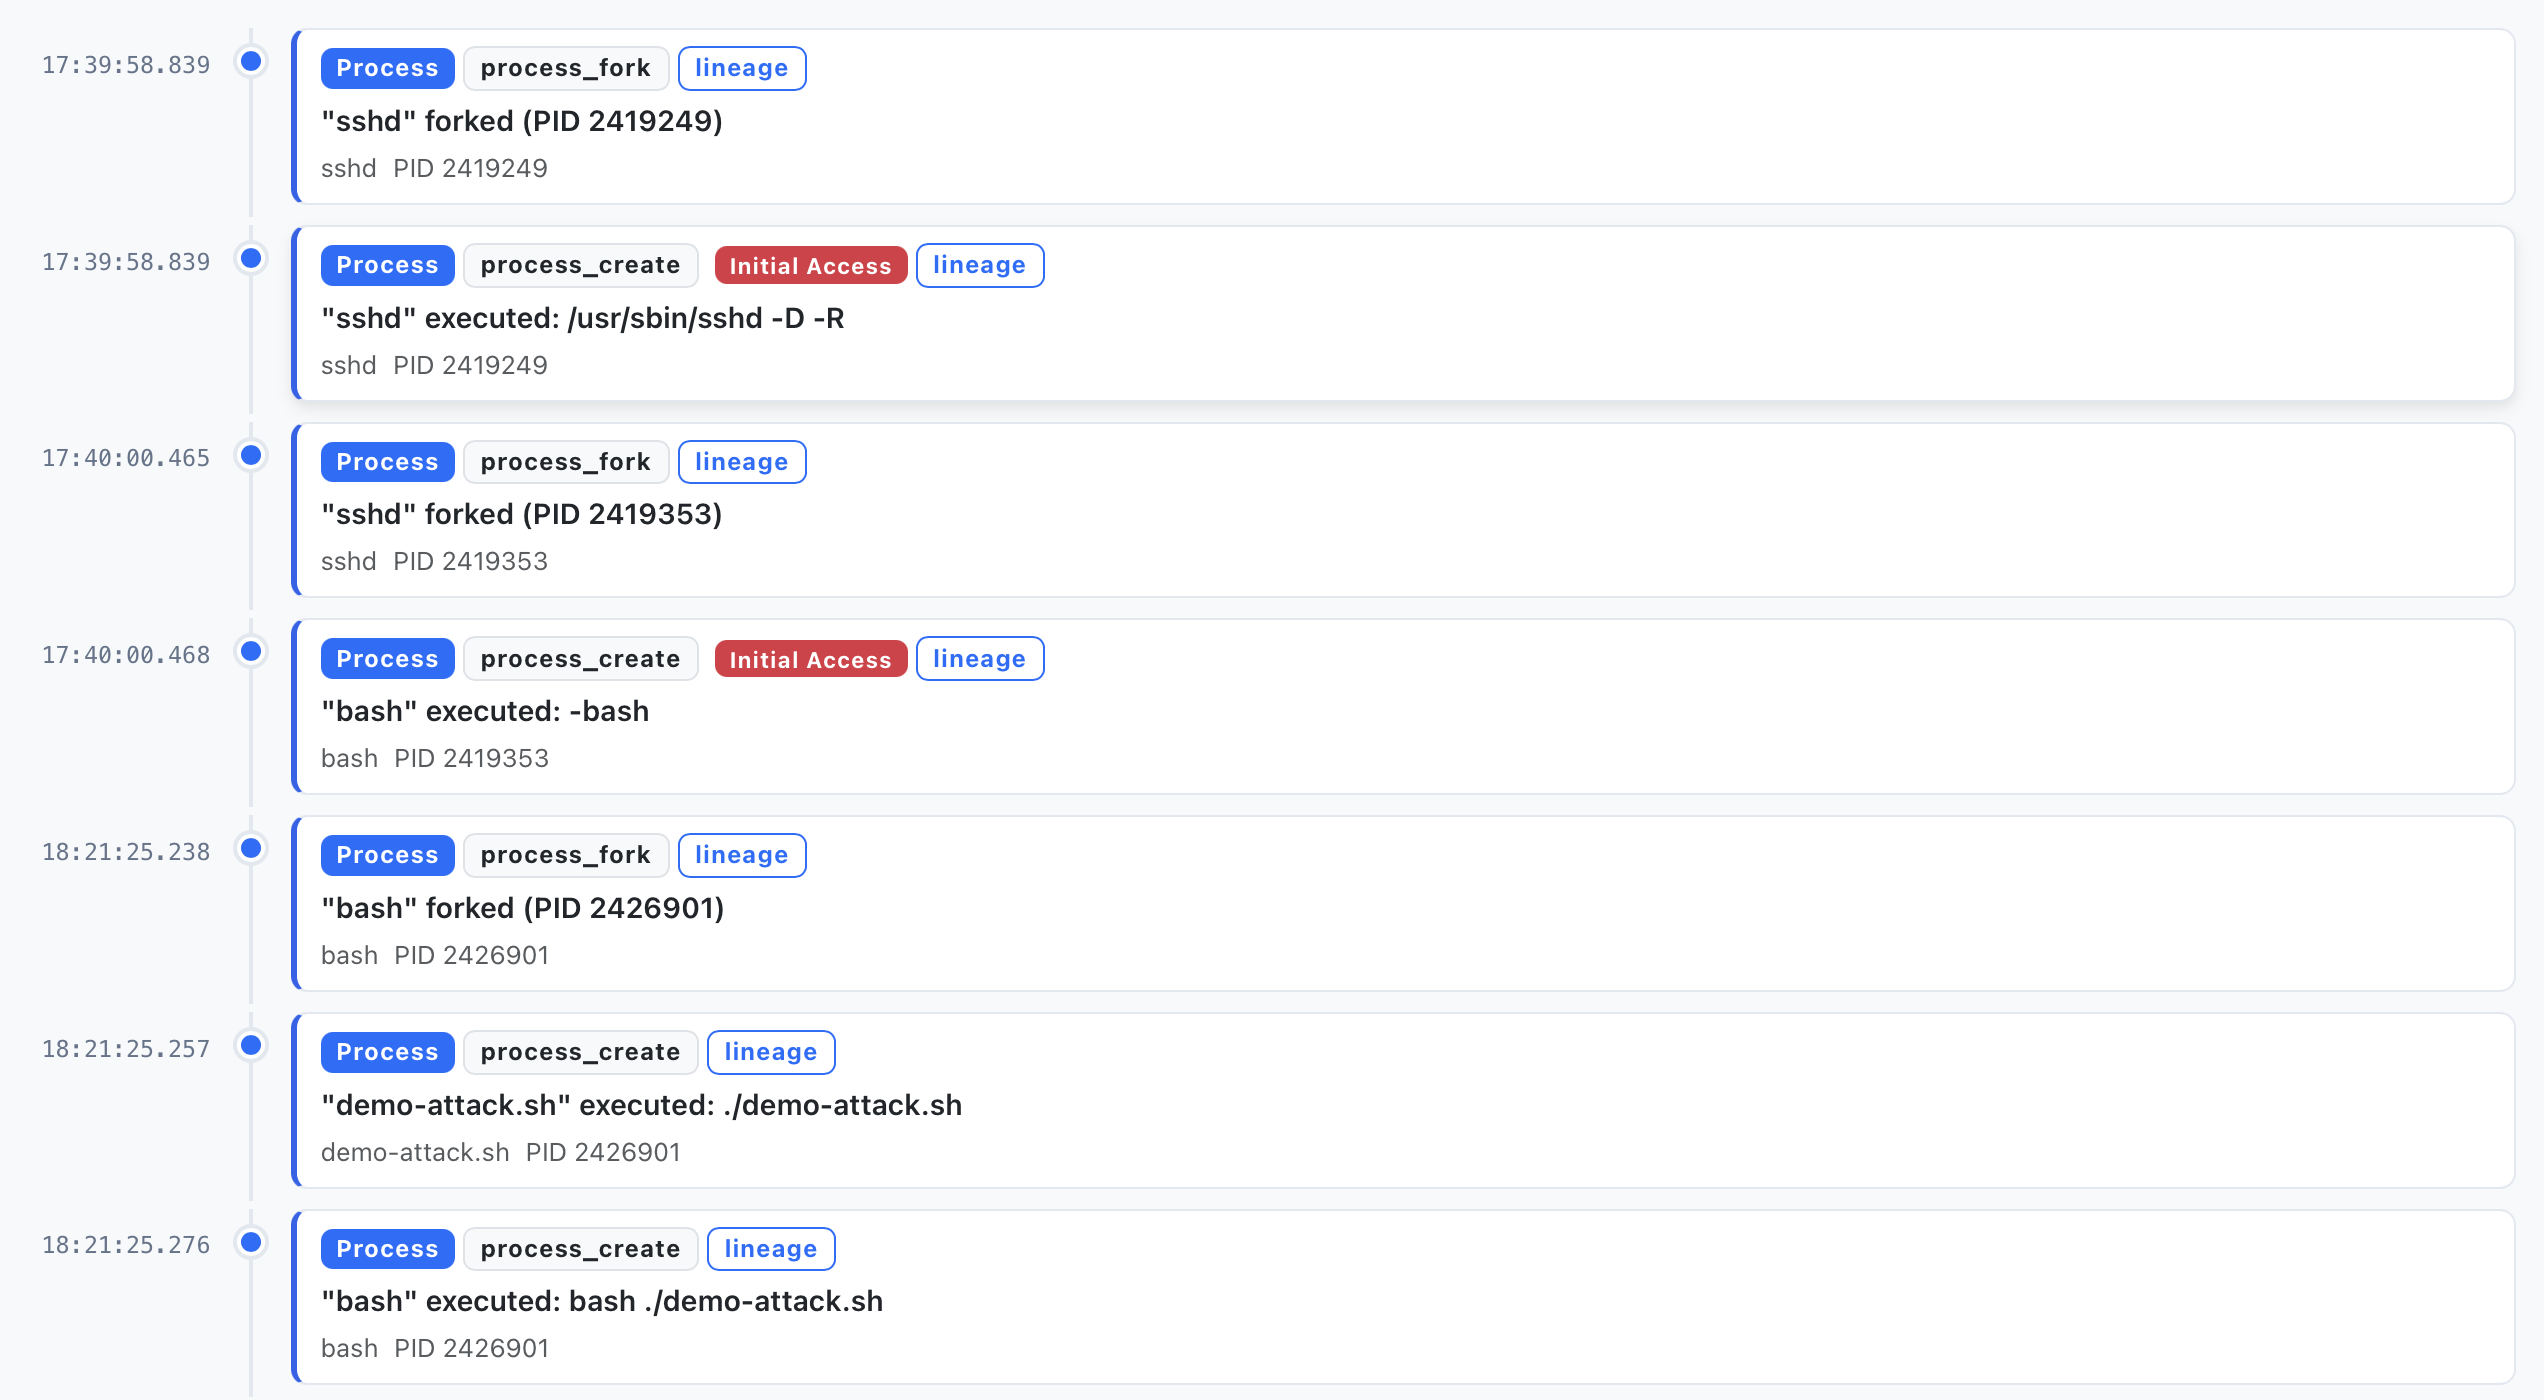
The agent iterates through these tools as needed — typically 3 to 7 tool calls per investigation — and then produces a structured verdict:
- Verdict:
true_positive,false_positive,needs_review, orinconclusive. - Confidence score: 0–100, reflecting how certain the agent is in its assessment.
- Summary: a 2–4 sentence explanation of what happened and why the verdict was reached.
- Impact assessment: what the potential or confirmed damage is.
- Recommended actions: specific next steps such as isolating a host, killing a process tree, investigating further, or reviewing access controls — each with a priority level.
Transparency, not a black box
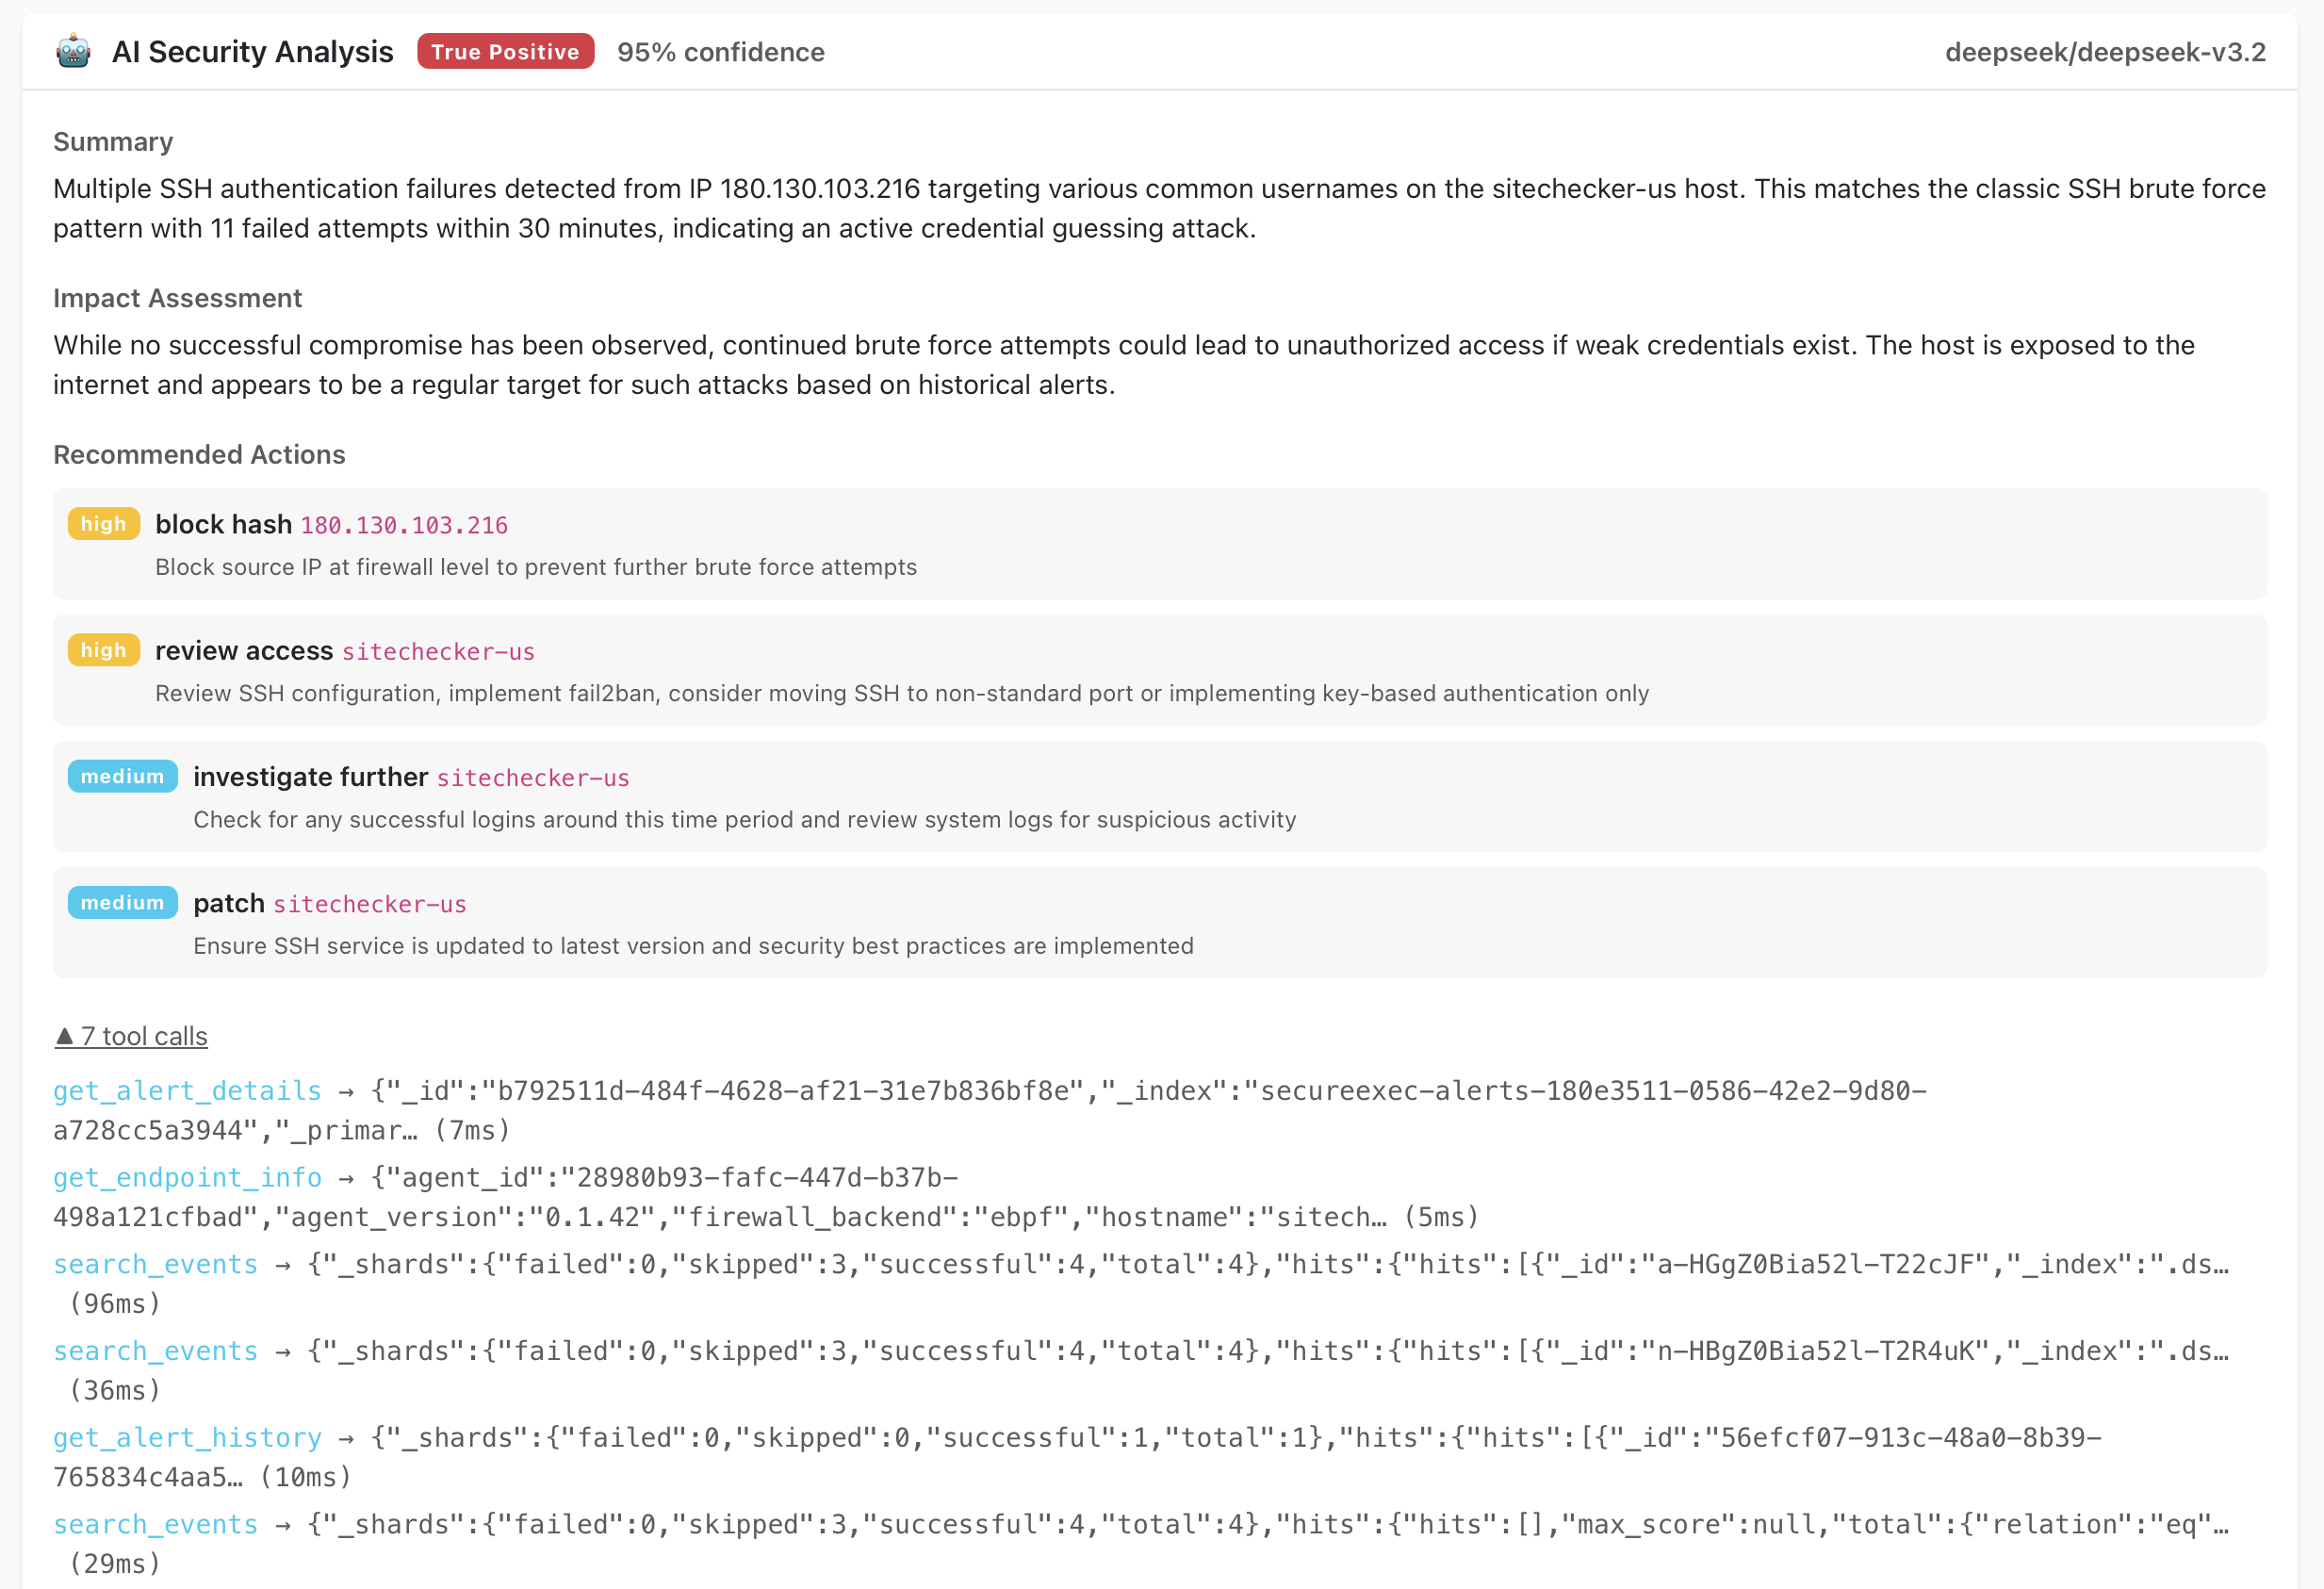
Every investigation is fully auditable. The UI shows each tool call the agent made, what arguments it used, what data it received, and how long each call took. If the agent concluded that an alert is a false positive, you can see exactly what evidence it based that conclusion on.
This matters because trust in automated triage depends on being able to verify it. An opaque "AI says it's fine" verdict is not useful in a security context. A verdict backed by a visible chain of evidence — "I checked the process tree and it's runc doing normal container orchestration, I checked the host and it runs Docker workloads, I checked history and this rule fires 12 times per day on this host" — is something an analyst can review in seconds and either confirm or override.
Real-world examples
True positive — SSH brute-force attack. The AI analyst identifies a systematic brute-force attack from a specific IP, confirms it matches known attack patterns, and recommends blocking the source, reviewing SSH configuration, and investigating for any successful logins.
False positive — container namespace change. A setns syscall triggers a container escape detection rule. The AI analyst checks the process tree, sees it was initiated by runc init as part of normal Docker orchestration, and correctly classifies it as expected behavior.
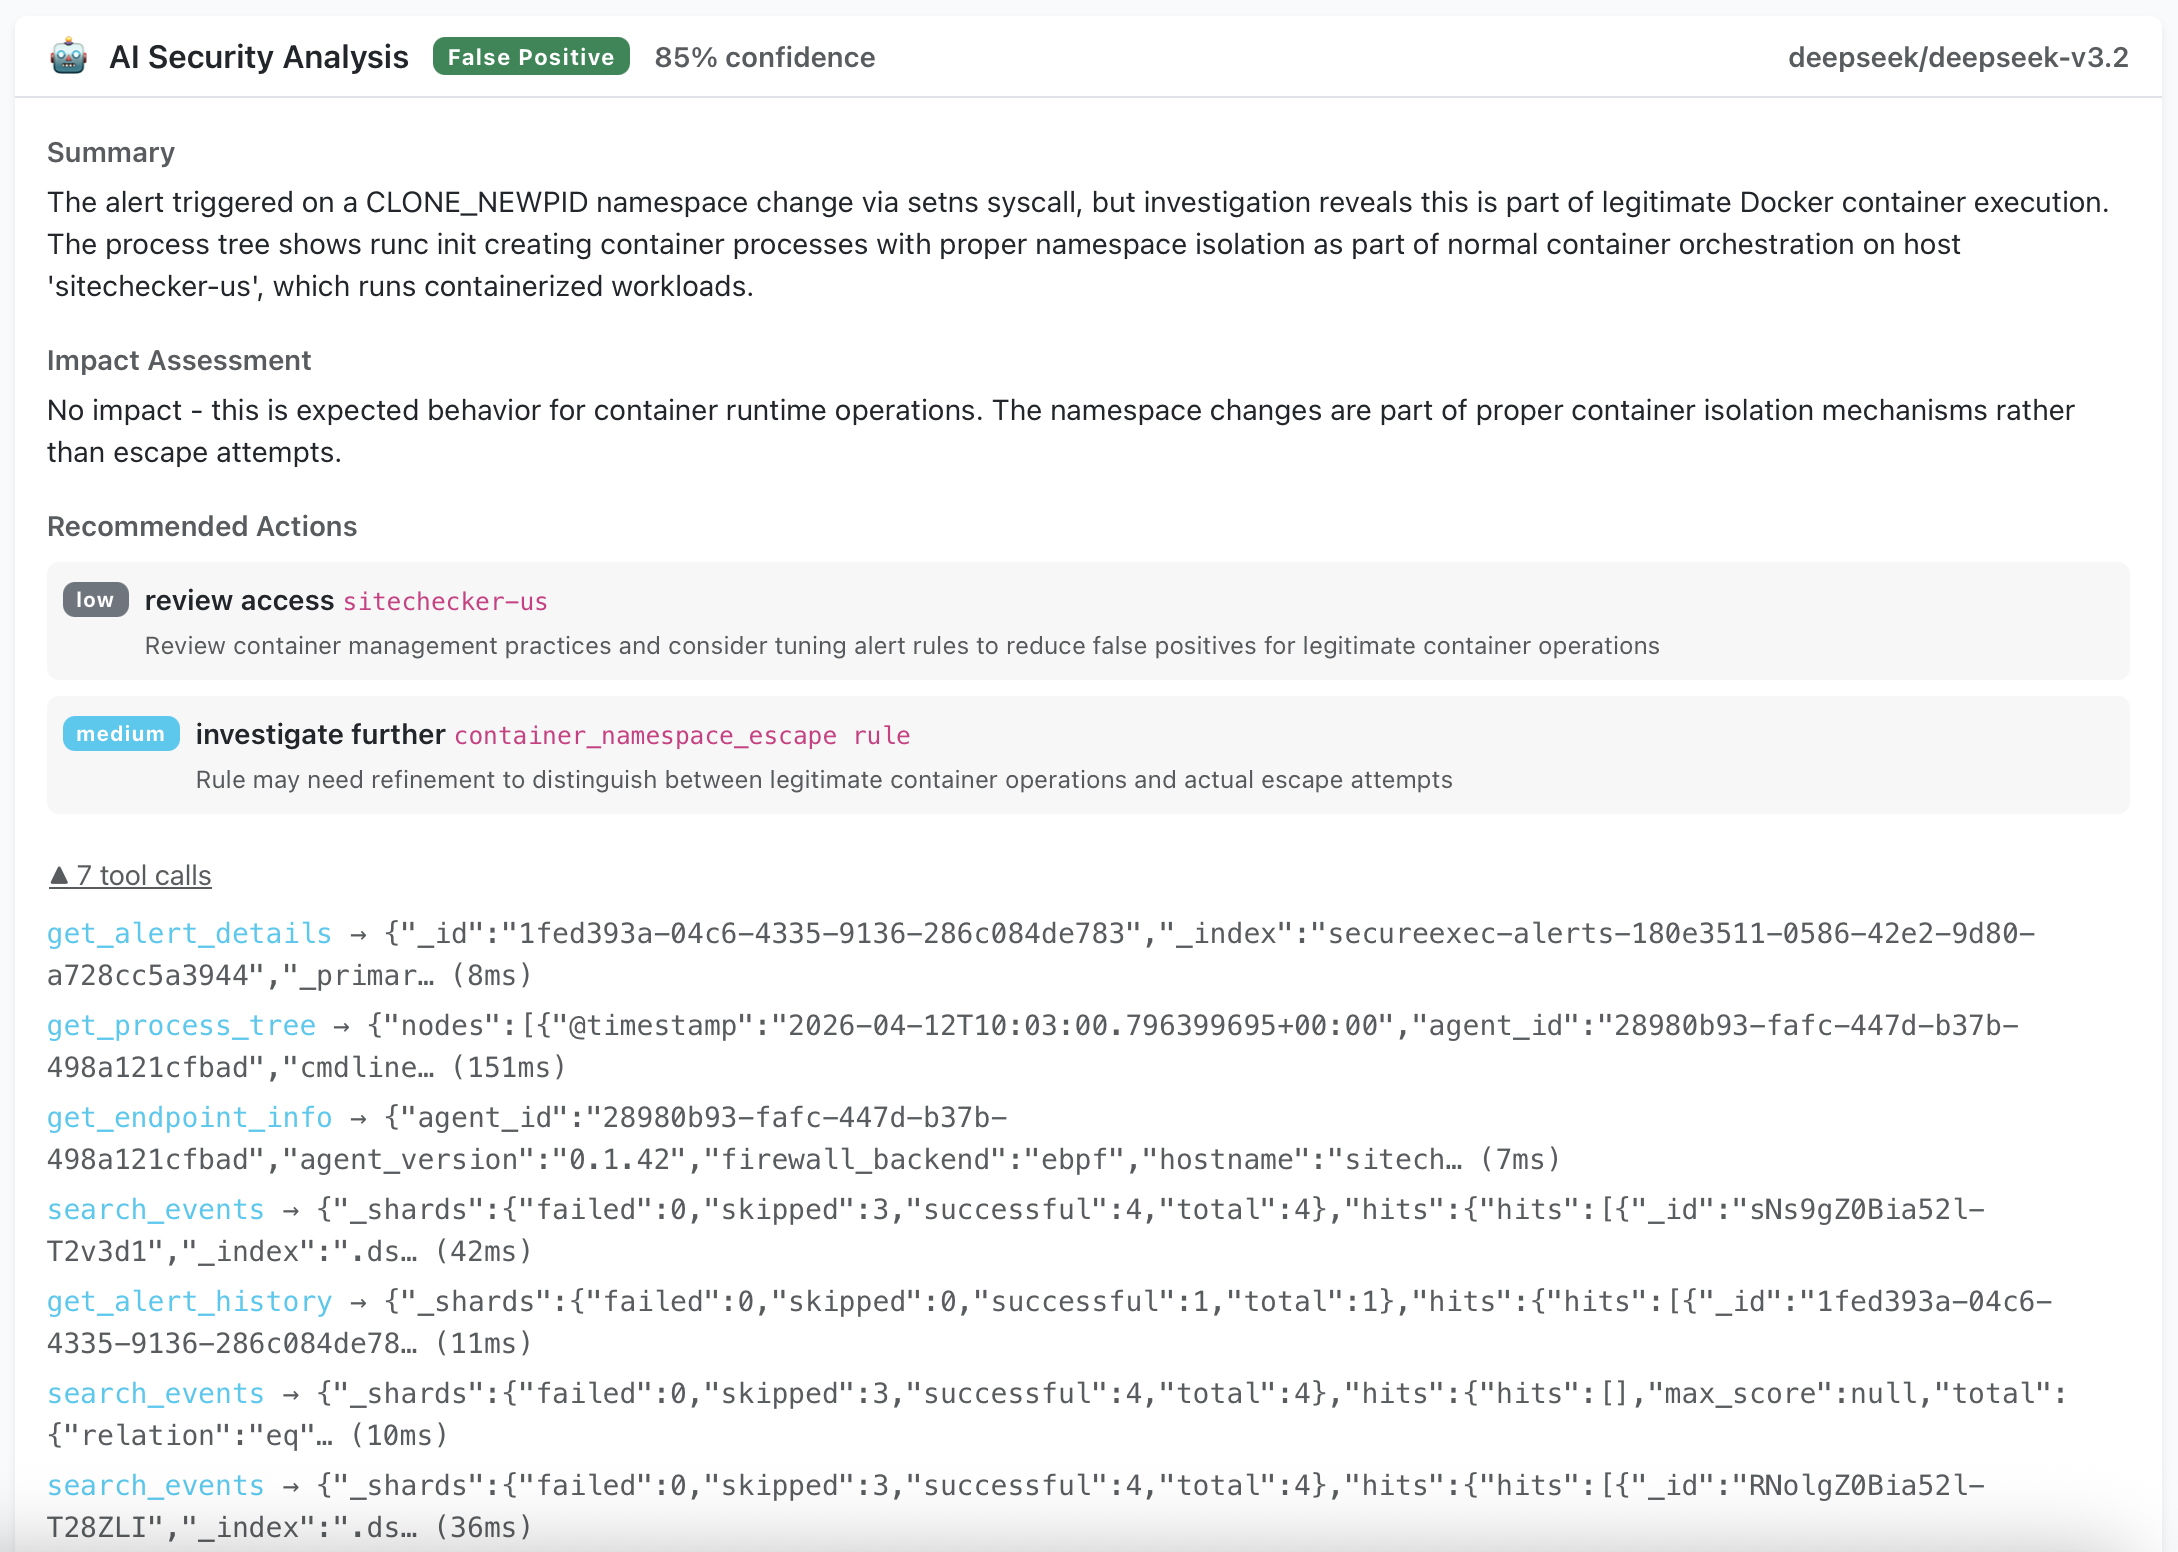
In both cases, the full chain of tool calls is visible — what data the agent requested, what it received, and how it arrived at its conclusion.
Your LLM, your data
SecureExec's AI analyst is designed to work with any OpenAI-compatible API endpoint. You can point it at:
- A cloud API like OpenRouter, giving you access to models from Anthropic, Google, Meta, DeepSeek, and others.
- A local model running on your own hardware via Ollama, vLLM, or any other OpenAI-compatible server.
When using a local model, no alert data leaves your infrastructure. The LLM runs on your network, queries your Elasticsearch instance through the same internal APIs the web dashboard uses, and writes the verdict back to your database. For environments with strict data residency or compliance requirements, this is the only viable architecture for AI-assisted triage.
Practical workflow
The AI analyst integrates into the existing alert workflow in three ways:
Automatic triage. When enabled, every new alert above a configurable severity threshold is automatically investigated. The verdict appears on the alert within seconds, before any human opens it. Analysts can start their shift with alerts pre-sorted into "confirmed threats", "likely false positives", and "needs human review" — instead of an undifferentiated queue.
Related alerts arriving from the same host within a short time window are grouped into a single AI case, so the verdict, summary and recommended actions are delivered once per incident rather than repeated per individual alert:
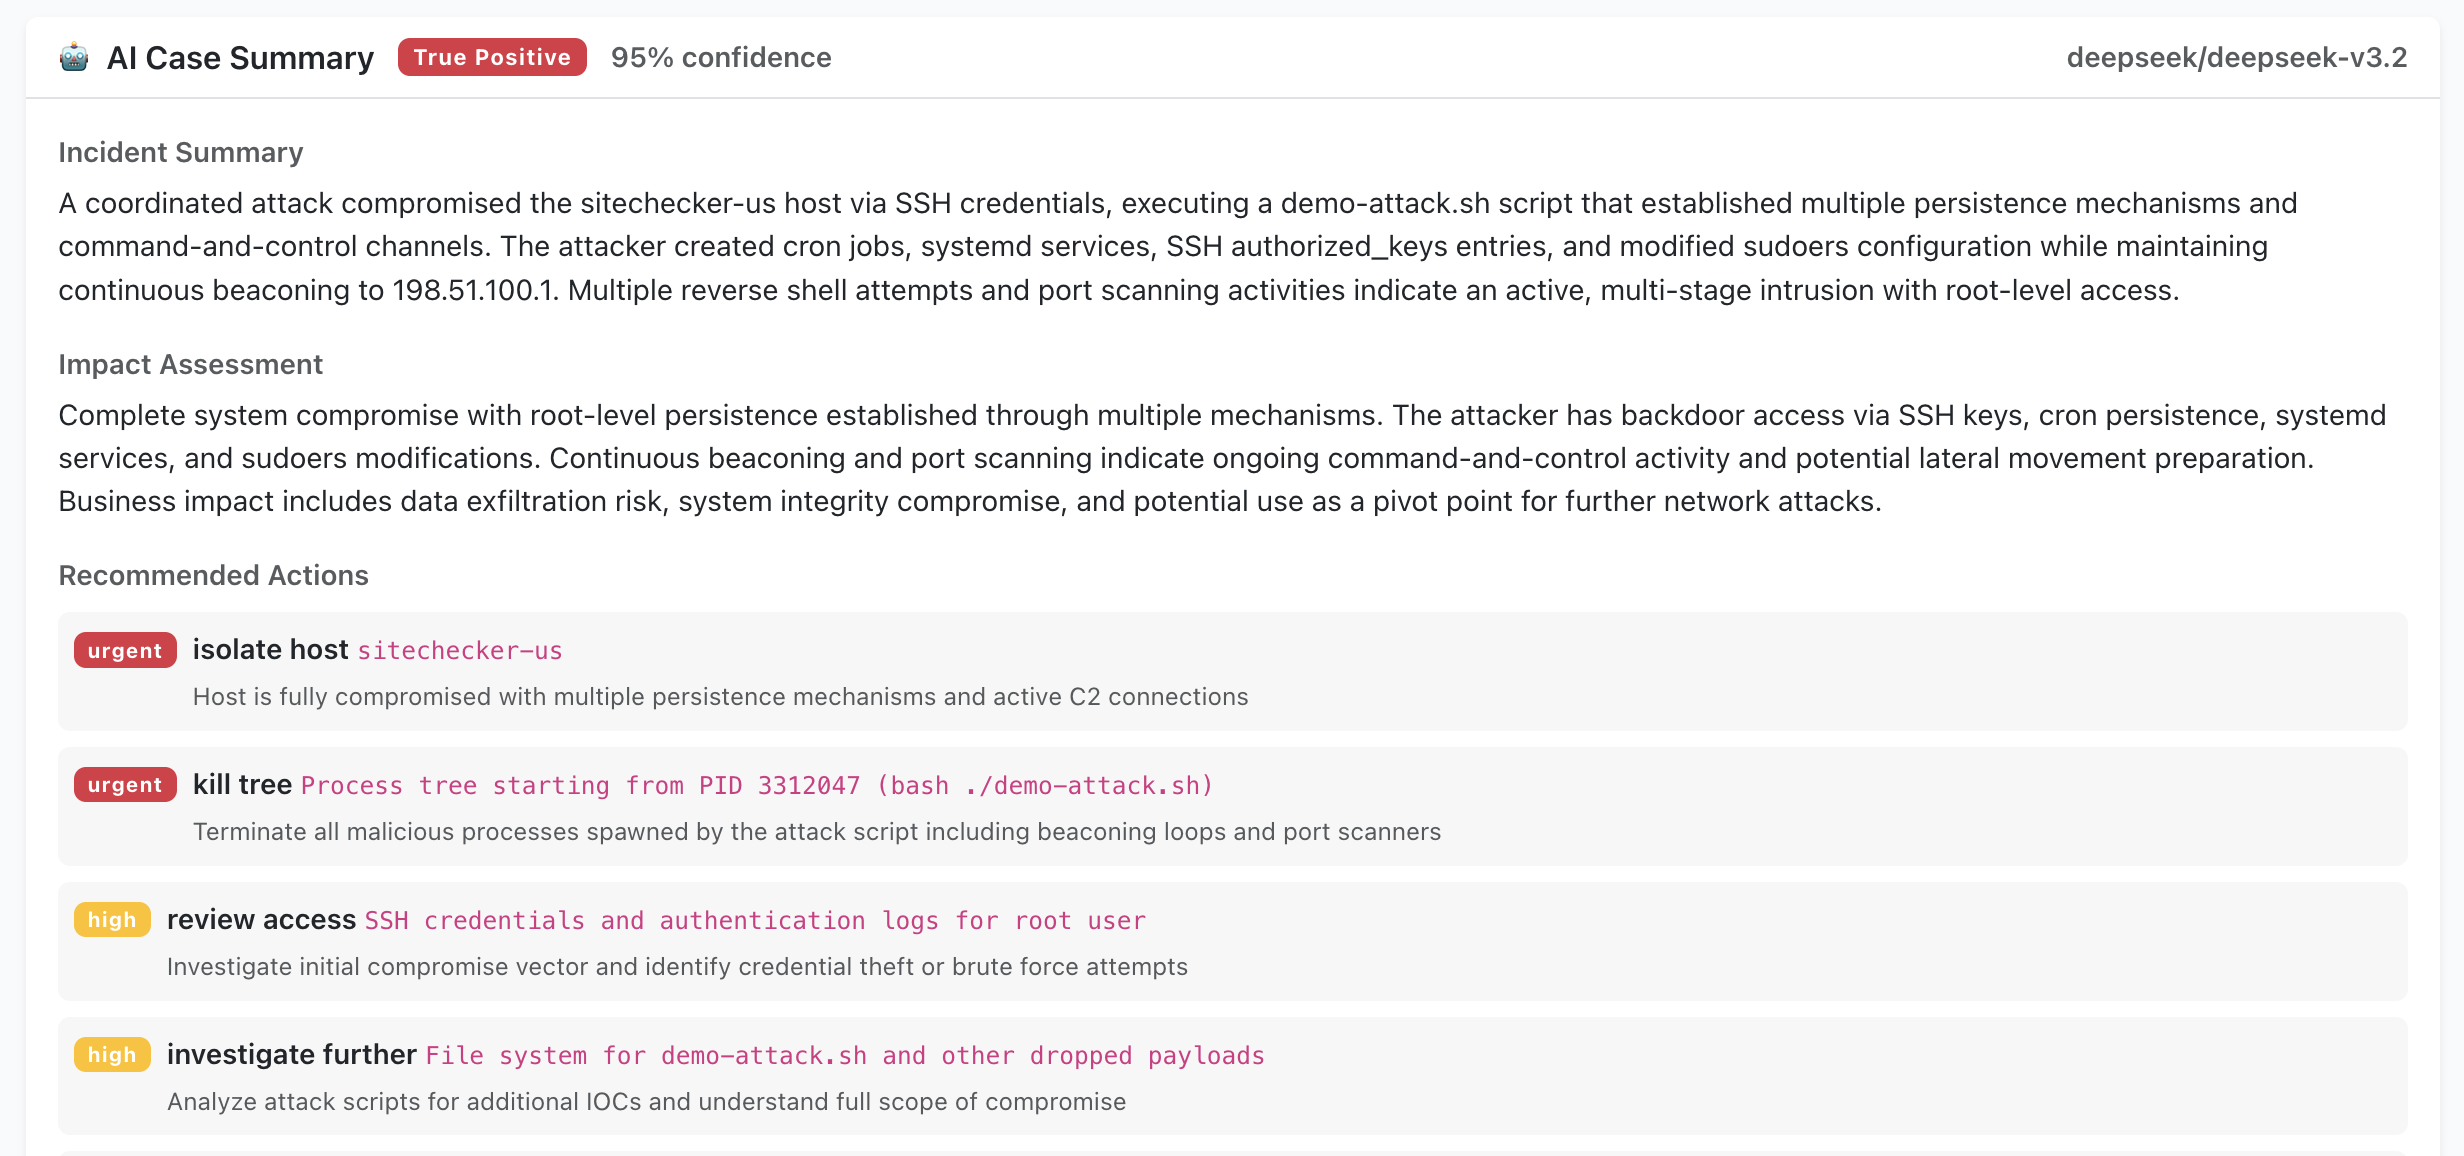
Manual investigation. Any alert or case can be investigated on demand with a single click. This is useful for alerts that arrived before auto-triage was enabled, or when an analyst wants a second opinion on a complex case.
Enriched notifications. When the AI analyst completes an investigation, notifications sent to Telegram or Slack include the verdict, confidence score, summary, and recommended actions alongside the standard alert fields. The analyst receiving the notification can often make a triage decision without opening the dashboard at all.
Impact on team capacity
The direct effect is a reduction in mean time to investigate (MTTI). Alerts that previously took 15–30 minutes of manual context-gathering are triaged in under a minute. But the second-order effects matter more:
- Junior analysts become effective faster. Instead of learning to navigate event logs and process trees manually, they can review the AI's investigation and learn the reasoning patterns. The investigation log is effectively a training document for every alert.
- Senior analysts focus on real incidents. When 80% of the queue is pre-triaged as false positive with visible evidence, senior engineers spend their time on the 20% that matters — confirmed threats that need containment and remediation.
- Night and weekend coverage improves. Auto-triage runs 24/7. A critical alert at 3 AM gets the same quality of initial investigation as one at 10 AM.
Getting started
Configuration takes under five minutes:
- Set three environment variables:
LLM_URL(your LLM endpoint),LLM_API_KEY, andLLM_MODEL(e.g.,anthropic/claude-sonnet-4,deepseek/deepseek-chat, or a local model name). - Enable the AI analyst in Administration > AI Settings.
- Configure the auto-triage severity threshold (default:
highand above) and maximum concurrent investigations.
The analyst works with whatever model you choose. Larger models produce more nuanced analysis; smaller models are faster and cheaper. The right balance depends on your alert volume and budget. Start with auto-triage on high and critical alerts, review the verdicts for a few days, and adjust from there.